Inventory bottlenecks for mobility-hub Haarlem with the Bicycle Traffic Monitor
Municipality of Haarlem
Inventory bottlenecks for mobility-hub Haarlem with the Bicycle Traffic Monitor
The municipality of Haarlem is working on a new mobility hub called 'Nieuw-Zuid'. Besides about 2,000 new homes, there will also be several shops and a regional mobility hub. The hub will include an underground bicycle parking facility with 2,500 spaces. The hub's design incorporates the cycling infrastructure in the immediate area. But bicycle trips extend beyond the immediate vicinity of the hub. The Bicycle Monitor was used for the design to determine potential bottlenecks in the new bicycle traffic to and from the hub.
Data-driven approach with FietsMonitor
To systematically identify the potential bottlenecks, a data-driven analysis was carried out. The Bicycle Monitor has been the basis for this. For relevant train stations and bus stops, the following questions were answered:
- How many cyclists come from there?
- How many cyclists go there?
- Where do the cyclists come from?
- What routes do the cyclists then take?
Growth scenarios for the new mobility hub were then determined by the municipality. Based on these scenarios, Witteveen+Bos used the FietsMonitor to identify potential bicycle bottlenecks in terms of capacity, flow, comfort, safety and missing links.
Bicycle flows to and from train stations and bus stops
Bicycle flows to and from train stations in Haarlem have been determined by using the following data, among others:
1. The number of people entering and leaving each station per day
2. The share of the bicycle in the so-called 'before and after transport' of public transport (data from the Dutch Railways)
3. The distances cyclists make/cycle to and from the station before the train ride (data from OnDerweg in Nederland (ODiN)).
For bicycle flows to bus stops, the number of bicycle-bus trips was first determined and bicycle routes were determined based on the trip length distribution (ODiN).
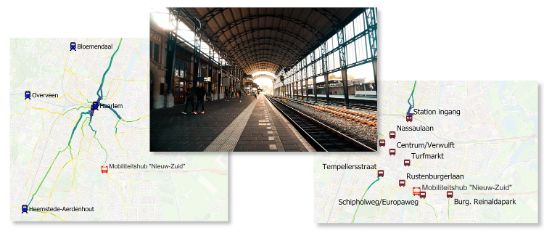
Thus, specific insight has been generated into bicycle trips to and from train stations and bus stops. In combination with the bicycle flows from the Bicycle Monitor Haarlem, the total bicycle flow was determined.
Future bicycle flows to the mobility hub
With the development of urban hub Nieuw-Zuid and the mobility hub, it is expected that bicycle flows to and from the new hub will change. Three scenarios have been defined for the future situation, incorporating both the new mobility hub and general growth in bicycle traffic. This results in an overview of important bicycle flows to and from the mobility hub in relation to existing bicycle traffic in Haarlem. The Bicycle Monitor has identified new bicycle flows and potential new and/or exacerbated bottlenecks in the Haarlem bicycle network.
Potential bottlenecks mapped
The analysis of potential bottlenecks identifies five aspects:
1. Capacity
2. Comfort
3. Flow
4. Safety
5. Missing links
Based on these aspects, a bottleneck analysis was made for existing and/or new bottlenecks in the new bicycle flows. This analysis was carried out for the cycle routes where a growth in bicycle traffic through the new mobility hub is expected.
In terms of comfort, it was determined that the bicycle facilities west of the new mobility hub, in particular, do not meet the desirable pavement type. The analysis of missing links shows that particularly the connection to the south of Haarlem and Heemstede is poor and may be missing a link there.
In terms of comfort, it has been determined that bicycle facilities to the west of the new mobility hub in particular do not meet the desirable type of pavement. The analysis of missing links shows that especially the connection to the south of Haarlem and Heemstede is poor and may be missing a link there.
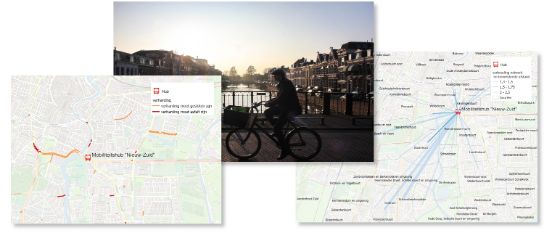
Input for the development of Haarlem Nieuw-Zuid
The analysis has been visualised in a map overview of potential bottlenecks. It provides important information for further planning around the urban node Haarlem Nieuw-Zuid. The Bicycle Traffic Monitor has thus contributed to providing insight into various growth scenarios, the impact on bicycle flows and the data-driven substantiation of the choices to be made.

Bicycle Traffic Monitor

More information?
Sander, a traffic data scientist, is the Bicycle Traffic Monitor's inventor, developer and product owner.
