National Physiological Equivalent Temperature Map online

National Physiological Equivalent Temperature Map online
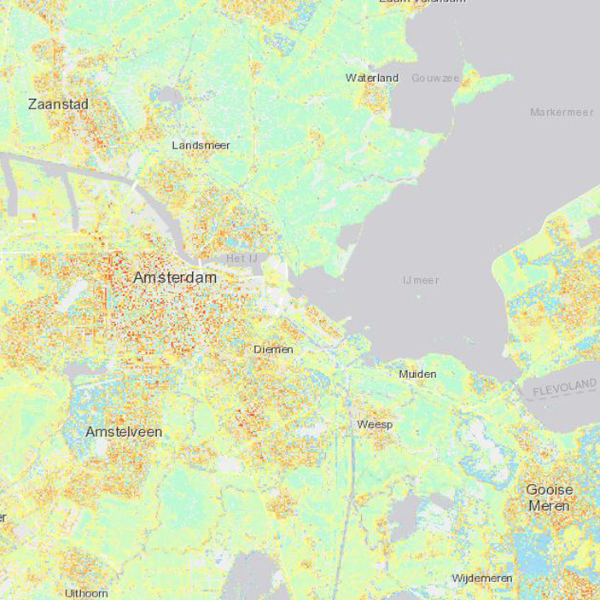
In June 2020, the national PET map was launched. Anyone can access this map, which gives the physiological equivalent temperature (PET) for the Netherlands on a hot summer's day. Unlike air temperature, the PET is a good indicator for heat stress. Witteveen+Bos developed the PET map in partnership with Wageningen University & Research and Climate Adaptation Services. You can view the map at www.klimaateffectatlas.nl.
As a result of climate change and urbanisation, the PET can soar on a hot summer's day. This can cause health problems and even fatalities. Uncertainty arises because different methods are used to determine the PET. To remove that uncertainty, researchers at Wageningen University & Research developed a standard method to calculate PET based on open data. On behalf of the Dutch Ministry of Infrastructure and Water Management, Witteveen+Bos used this new standard to make a very detailed map of the PET on hot summer's days in the Netherlands.
Anna Goede, urban climate adaptation specialist at Witteveen+Bos: 'A temperature of 30 degrees Celsius is lovely when you're relaxing on a beach on holiday. In an urban environment, however, out of the wind and in blazing sunshine, the same temperature can feel like 40 degrees. This is because the PET is not the same as the air temperature. The PET indicates how hot a person is and is also determined by the surroundings. In the city, it often feels hotter because the buildings are close to each other and there is not much green.'
The PET partly depends on the person. The elderly, for example, are more prone to heat stress because they are less able to regulate their body heat. The PET is also determined by the presence of sun, shade, wind, trees and buildings. The PET map shows in detail how the PET varies in urban areas. There is a great deal of heat stress in densely built-up areas. It is cooler in open spaces, near water and in parks with trees. Anna Goede: 'We hope that municipalities will use the map in their climate adaptation and public health policy. For example, by looking at heat stress in care homes. The map shows where it can get extremely hot. The municipality can take this into account in area development and when designing public areas.'
Climate Adaptation Services has included the map in the Climate Impact Atlas. Other maps are available at www.klimaateffectatlas.nl. These give an impression of the threat of flooding, drought and heat as a result of climate change.