Data to support bicycle action plan
Municipality of Haarlem
Data to support bicycle action plan
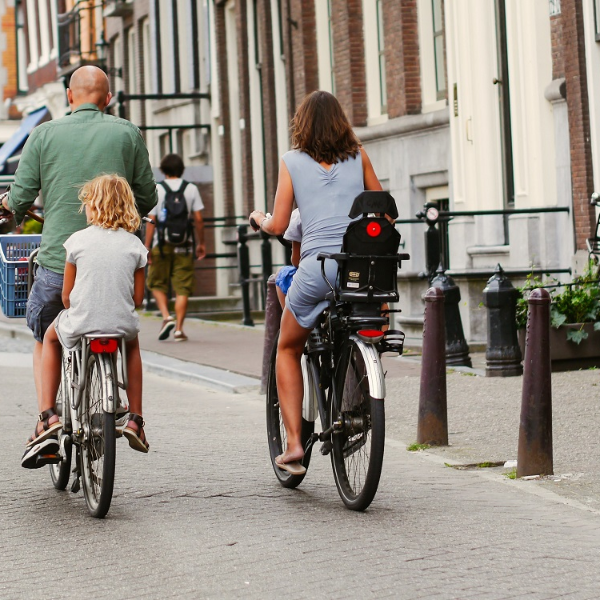
The Municipality of Haarlem had already sketched the outline of their bicycle action plan. In the autumn of 2019, it was time to add data to support it. The plan had to be ready for publication by early 2020 – but where to start? The Bicycle Traffic Monitor was used.
Information and speed: the answer lies in the data
In the past, it would have been a time-consuming and labour-intensive task. The different sources of information would have formed a challenge to providing, in a timely manner, a satisfactory and comprehensive justification of the plan. What was lacking was a comprehensive picture of the possible data sources and their potential – but the data was there. Essentially, the challenge was to unlock the data and combine it, and showing how it could help tackle the challenge and what insights it could provide.
The possibilities of bicycle data
Sander Veenstra, traffic expert and data engineer at Witteveen+Bos, has cleverly employed bicycle and mobility data for various urban projects. He began a dialogue with the Municipality of Haarlem by asking: ‘For which questions is the data needed to help answer? Once we know that, we can start finding the right data sources and working with them to obtain the required information.’
Data-driven digital bottleneck map
The most urgent need in terms of information was for a well-substantiated bottleneck map. This would answer the question of where bicycle investments would be most effective. The starting point was to provide insight into the cycle paths’ capacity, in combination with the expected intensity of use and the quality of the cycle network’s surface.
Based on guidelines, as well as the municipality’s level of ambition, a definition was come up with for what comprises a bottleneck – and these were then mapped out. This information was subsequently used to identify data sources that could answer the following questions: Where do accidents involving cyclists occur? Where do bicycles and cars cross paths and what delays does this cause for the cyclist?
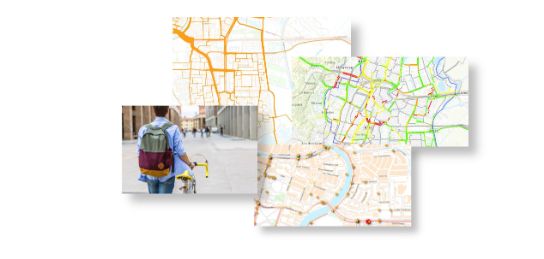
Combining bicycle-related data sources in a traffic model framework
The Bicycle Traffic Monitor is a traffic model framework. It cleverly unlocks and combines bicycle-related data, leading to policy-relevant information on bicycle traffic. The essential idea is that each data source can provide insight into bicycle flows and the bicycle network. By using as many public data sources as possible as a basis, an initial picture of bicycle flows at any location in the Netherlands can quickly be obtained.
Within a short timeframe, a data-driven bottleneck map was created for the Municipality of Haarlem. The municipality’s policy department could, in turn, analyse it based on the first-hand experiences of the municipality and its employees. The map was validated by the municipality and found to be surprisingly similar to its intuitive sense of the situation.

An increased desire for insight
The Municipality of Haarlem has received the help it needed for its bicycle action plan. The Bicycle Traffic Monitor was cited as its data-driven foundation. During the process, the municipality learned that data provides many opportunities to gain new insights and support existing measures.
Witteveen+Bos and the Municipality of Haarlem have since begun discussing further possibilities. Whereas the Bicycle Traffic Monitor was initially intended to visualise existing data (descriptive), work is now being done on using it to provide insight into the effects of potential policy measures (predictive). We are currently busy developing a function that will allow the municipality to analyse the effects of changes to the bicycle network, such as the construction or improvement of bicycle connections.

Bicycle Traffic Monitor

More information?
Sander, a traffic data scientist, is the Bicycle Traffic Monitor's inventor, developer and product owner.
